The U.S. states with the widest wealth gaps between rich and poor
New study reveals where America’s income inequality hits hardest, and what it means for residents.
The research, conducted by Dancing Numbers, a data automation platform for QuickBooks, analyzed 2023 Census and IRS data to create a “Wealth Inequality Score” (0–100) for every U.S. state and the District of Columbia. The score factors in each state’s Gini coefficient (how evenly income is distributed), the income ratio between the top 1% and bottom 50%, and the poverty rate. The higher the score, the wider the gap.
As Punit K. Jindal, founder of Dancing Numbers, explains:
“Wealth inequality isn’t just a number on a spreadsheet. It shapes access to education, healthcare, housing, and the ability to build generational wealth. Understanding where these gaps are largest helps us identify communities that need stronger economic support systems.”
Here’s how each state stacks up.
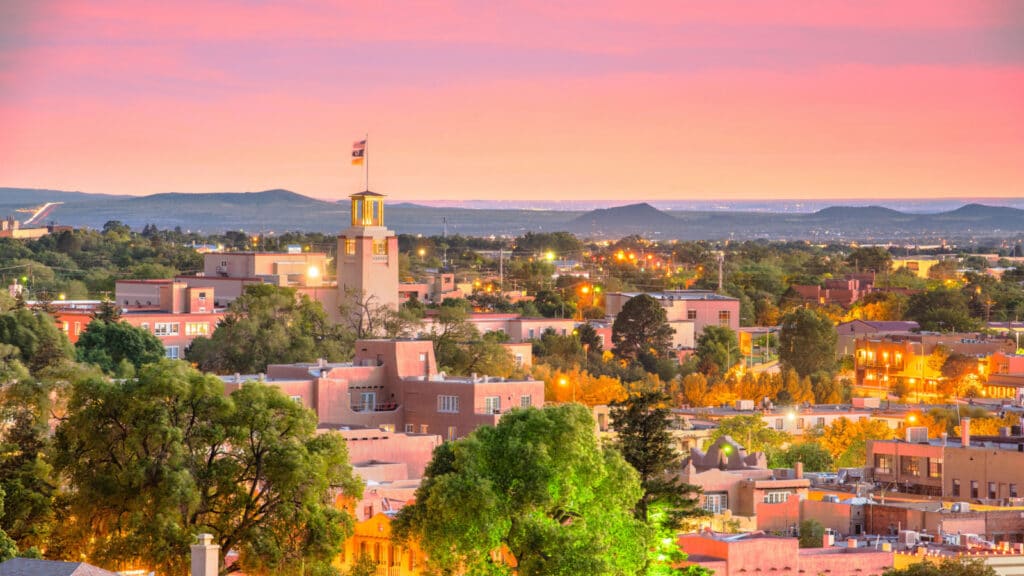
10. New Mexico
New Mexico kicks off the list with a Wealth Inequality Score of 53.94. The state’s poverty rate sits at 17.8%, and its median income is $62,268. While the top 1% capture a smaller income share than in other states, widespread poverty and limited economic diversification keep inequality high.

9. California
California earns a 55.94 score, with a 0.487 Gini coefficient and a median income of $95,521. The gap between its wealthy and working-class residents continues to widen, fueled by sky-high housing costs. The tech boom has created massive wealth, but not evenly. Many middle-income workers are priced out of major job centers.
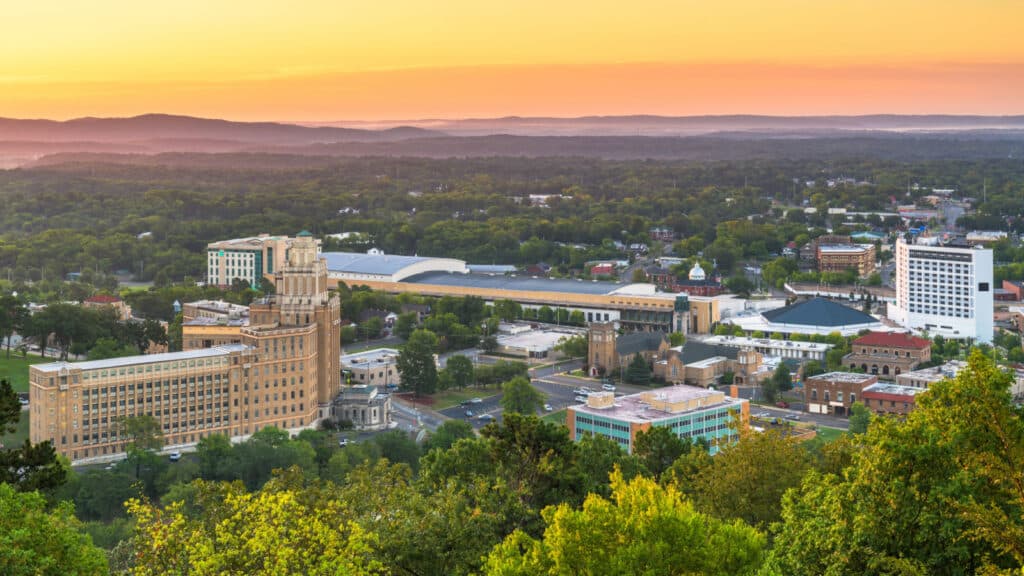
8. Arkansas
Arkansas lands next with a score of 56.13. Its Gini coefficient sits at 0.474, and the median household income is just under $59,000. More than 15% of residents live in poverty, and rural wages have struggled to keep up with national averages.
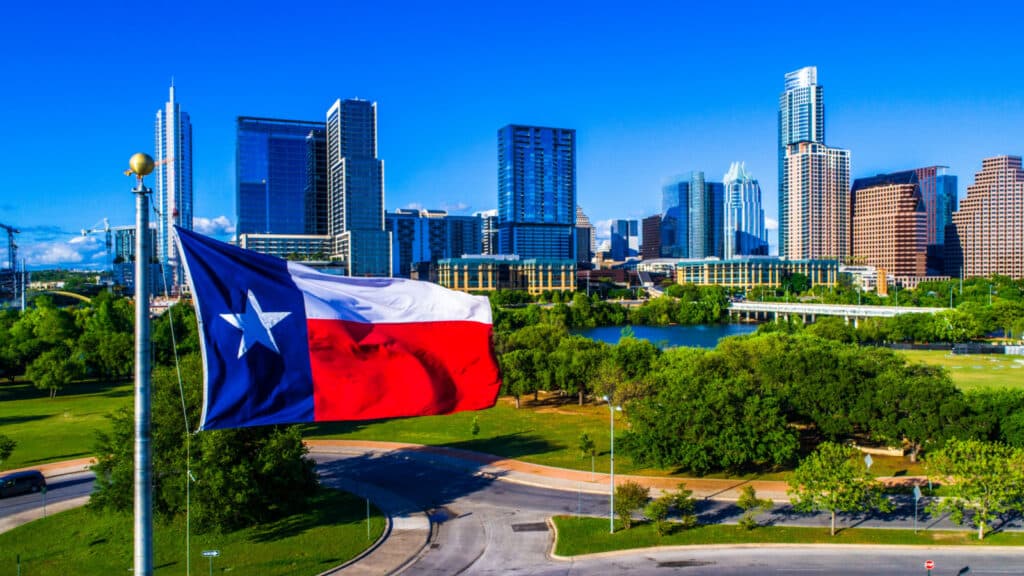
7. Texas
Texas has a 57.40 score, driven by a 0.479 Gini coefficient and median income near $75,780. The state’s booming tech and energy industries have made some residents very wealthy, but many middle-class families find themselves squeezed by rising housing and healthcare costs.
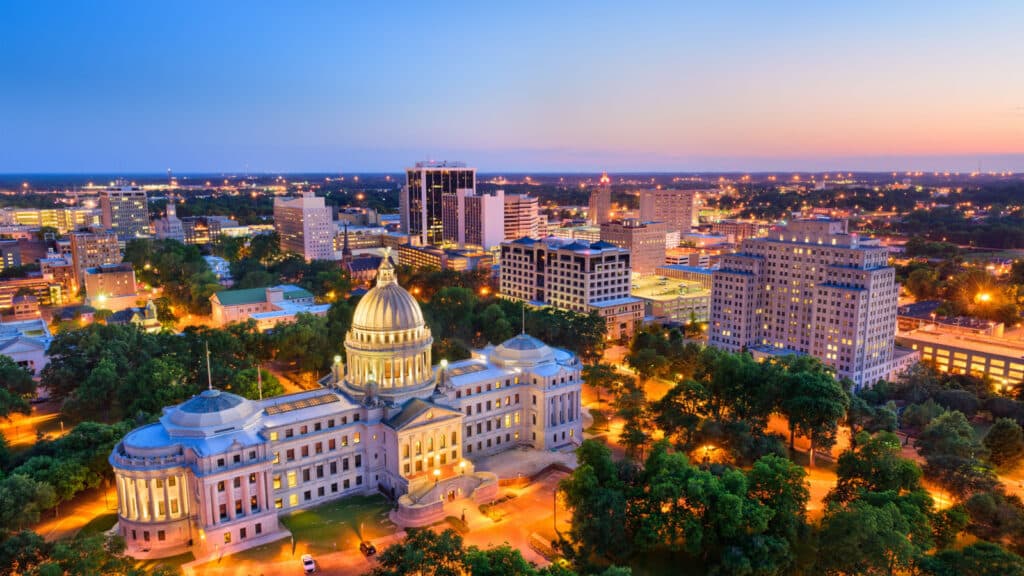
6. Mississippi
Mississippi, with a score of 60.91, has both one of the lowest median incomes ($54,203) and one of the highest poverty rates (18%) in the country. The Gini coefficient of 0.484 shows wealth concentration even in a state with relatively modest top-end earnings.
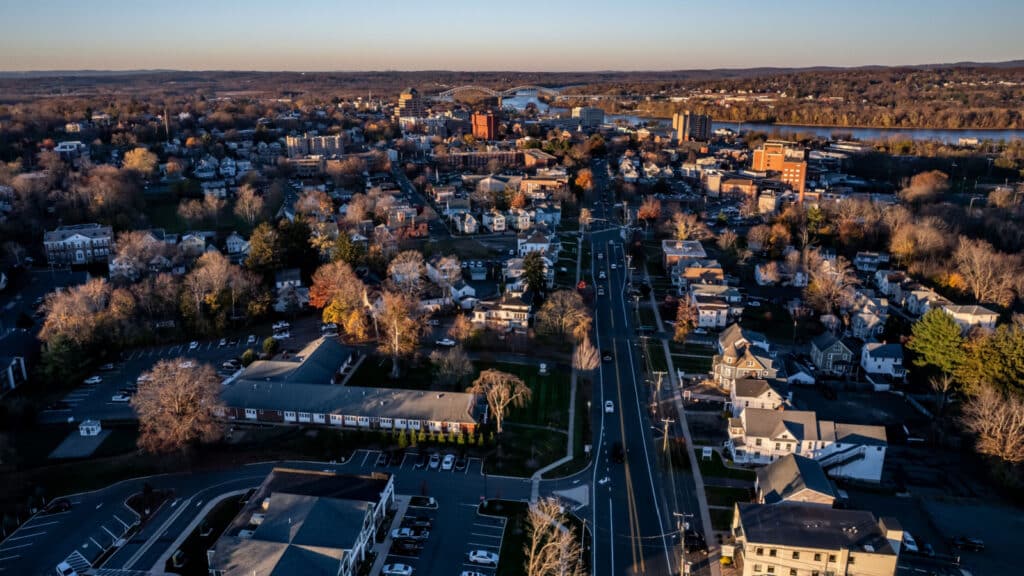
5. Connecticut
Connecticut’s 61.22 score comes from a Gini coefficient of 0.495, a median income of $91,665, and the lowest poverty rate in the top 10 at 10.3%. Affluent suburbs near New York City contrast sharply with post-industrial cities like Bridgeport and Hartford. Wealth clusters in Fairfield County continue to drive the averages upward.

4. Florida
Florida earns a 65.50 score, and its top-1%-to-bottom-50% ratio of 0.3650 is the highest in the country. The state’s lack of income tax attracts wealthy residents, but that revenue gap is often filled through sales taxes that hit lower earners harder. Median household income is $73,311, and cost-of-living pressures remain steep.
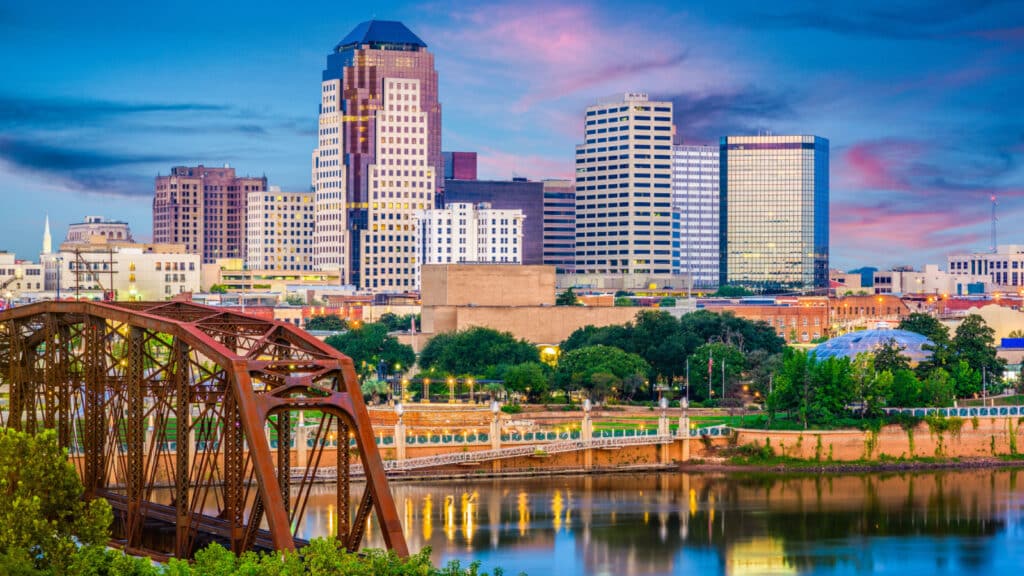
3. Louisiana
Louisiana ranks third with a 71.17 score, a 0.497 Gini coefficient, and the highest poverty rate in the top 10 at 18.9%. Its median income is just $58,229.
“Louisiana faces a different challenge than New York or D.C.,” says Jindal. “This isn’t about billionaires inflating the numbers—it’s about opportunity gaps.”

2. District of Columbia
Washington, D.C., scores 79.9 and ties New York for the most unequal Gini coefficient at 0.516. Despite the highest median income on the list – $108,210 – about 14% of residents live in poverty.
“D.C. shows how a high median income doesn’t guarantee equity,” Jindal notes. Wealth pools at the top, while service and education workers struggle with housing costs.

1. New York
At the top of the list is New York, with a Wealth Inequality Score of 82.24. The state’s 0.516 Gini coefficient ties it with D.C. as the most unequal in America. Its median household income is $82,095, yet 14.2% of residents live in poverty. The state’s wealthiest 1% earned nearly a third of what the bottom half made combined.
“New York’s numbers tell a familiar story,” Jindal says. “Extreme wealth is concentrated in Manhattan and surrounding financial hubs, while many working families struggle with high living costs.”
If you’re curious how this stacks up with other quality-of-life measures, you can also explore where Americans are finding the most fulfilling places to settle down—and which states are leading the pack for those planning their retirement years.
The 10 Best States To Retire in 2025, According to New Data
Choosing where to spend your retirement years is no small decision, especially when you’re balancing affordability, healthcare access, and long-term peace of mind.
Read more: The 10 Best States To Retire in 2025, According to New Data
The 10 Worst States To Retire in 2025, According to New Data
If you’re narrowing down your retirement shortlist, these 10 states may be worth crossing off.
Read more: The 10 Worst States To Retire in 2025, According to New Data
12 of the Best and Worst Cities to Retire in the U.S., According to a New Study
In the U.S., some benchmarks make some areas better or worse for retirees than others. A recent study took a deep dive, ranking over 180 cities based on affordability, quality of life, healthcare, and fun activities. These are some of the best and worst cities to consider for your sunset years.
Read more: 12 of the Best and Worst Places To Retire in the U.S., According to a New Study
10 of the Best U.S. States To Live In, According to a New Study

Recently, a study dug into the nitty-gritty of all 50 states, looking at housing costs, income growth, hospital quality, education rates, average hours worked per week, and commute times. After crunching all those numbers, the results are in for the ten best states to live in
Read more: 10 of the Best U.S. States To Live In, According to a New Study
The Least Friendly Cities in America, According to a New Study
Not every city is overflowing with warm smiles and helpful neighbors.
Read more: The Least Friendly Cities in America, According to a New Study